As the earnings calendar dictates, here’s another recap incoming.
Today I’ll be rounding out the big three of gaming after my articles on Microsoft and Nintendo!
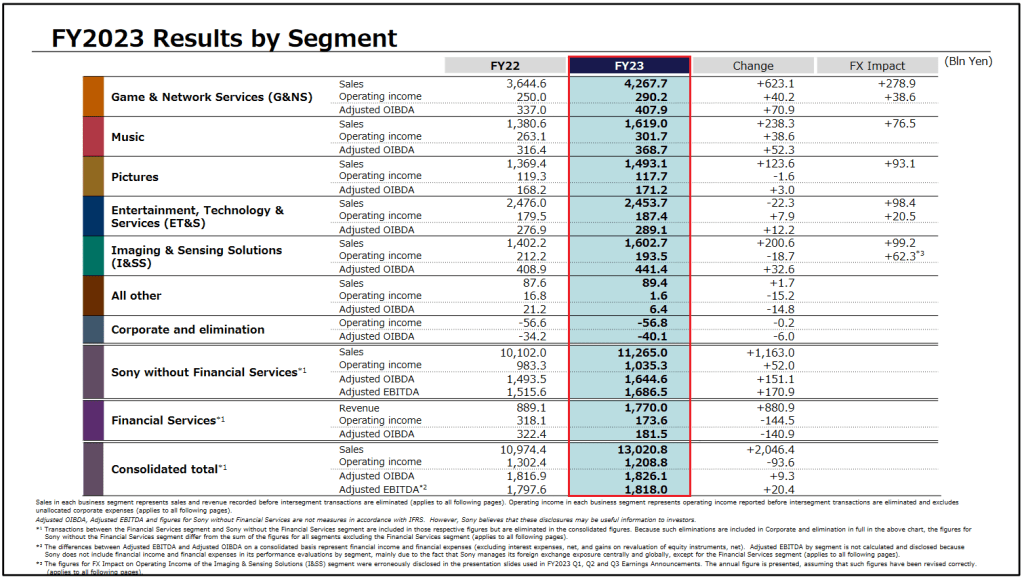
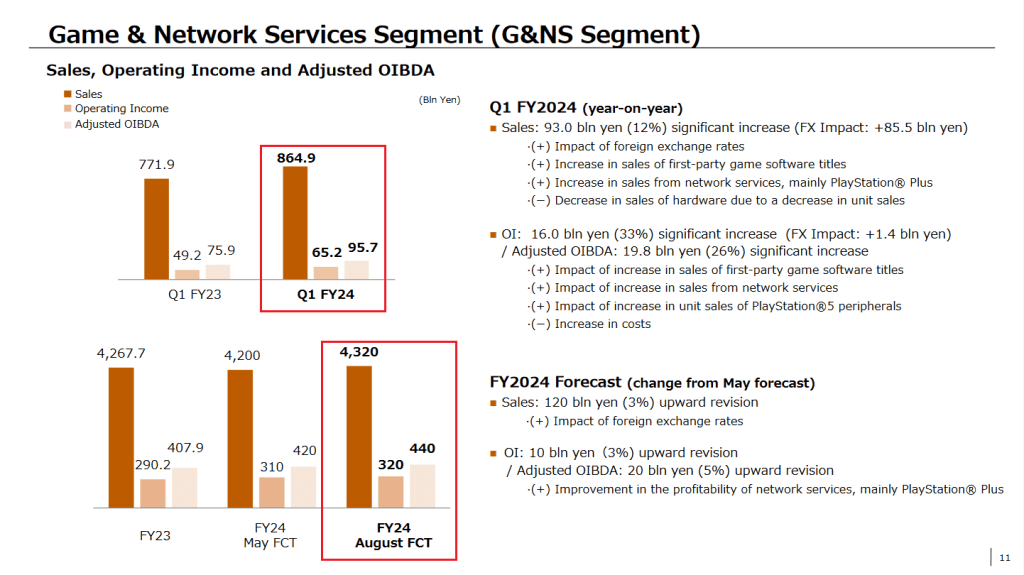
Sony Corp shared fiscal 2024 first quarter results in Japan. As usual, I’ll focus on its Game & Network Services (G&NS) segment i.e. the PlayStation business, which had a solid three-month period, boosted by services and add-on content, despite a distinct lack of catalysts especially for hardware.
Here’s the headlines from PlayStation’s April to June 2024 quarter.
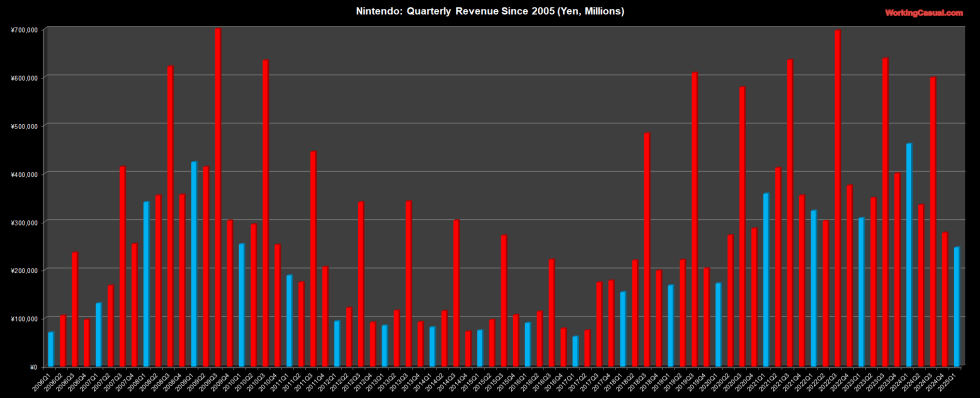
- Revenue increased 12%, albeit mostly due to yen weakness.
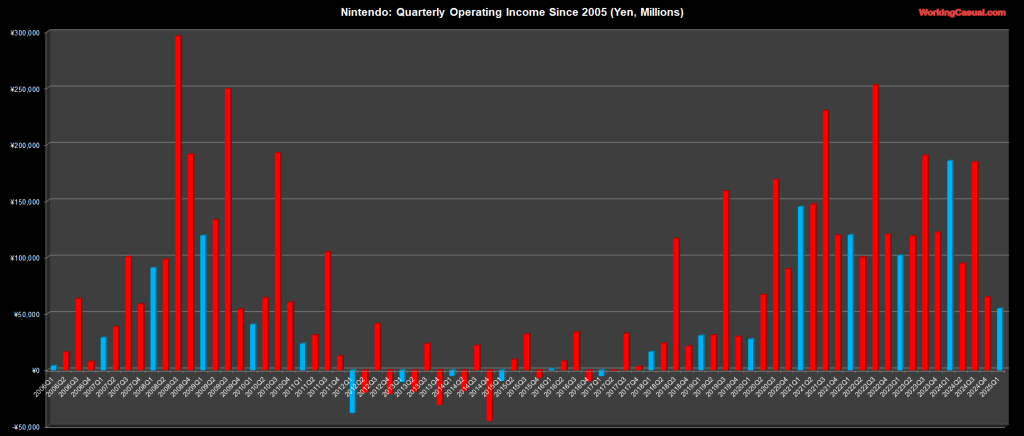
- Operating profit moved up over 30%.
- PlayStation 5 hardware unit sales declined double-digits.
- PlayStation Network (PSN) saw comfortable user growth.
There’s significant impact from currency movements on a Japanese company that operates globally. Fluctuations have a major impact on sales, and to a lesser extent on profit. As I’ll show later, without exchange rate deterioration, PlayStation revenue growth would be a more modest 1%.
PlayStation 5 shipments appear to have topped off, at least for now and perhaps permanently, as it now trails its predecessor by an even wider margin than last quarter. The upward trajectory of financials here are being bolstered by PSN and downloadable content spend, not to mention savings from laying people off and closing studios.
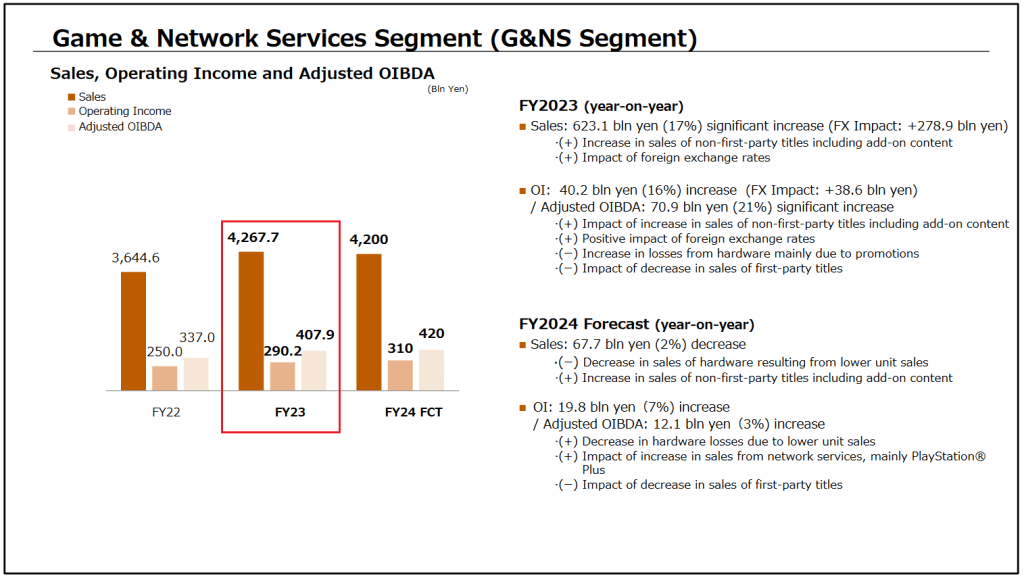
Management pointed out an “increase in sales from network services, mainly PlayStation Plus,” which clearly benefited from recent price increases, while also noting the “decrease in sales of hardware due to a decrease in unit sales.”
Read on for a closer look at the group’s performance plus a set of near-term predictions.
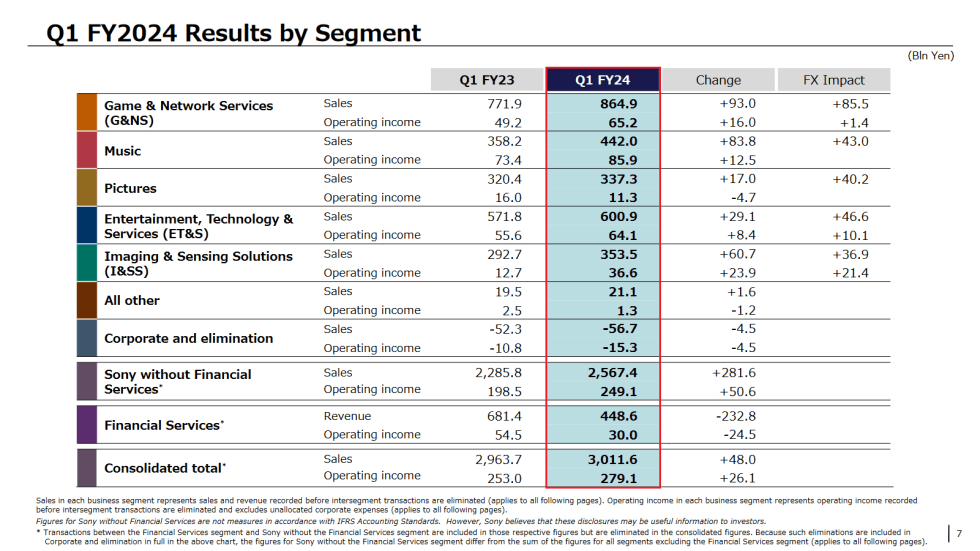
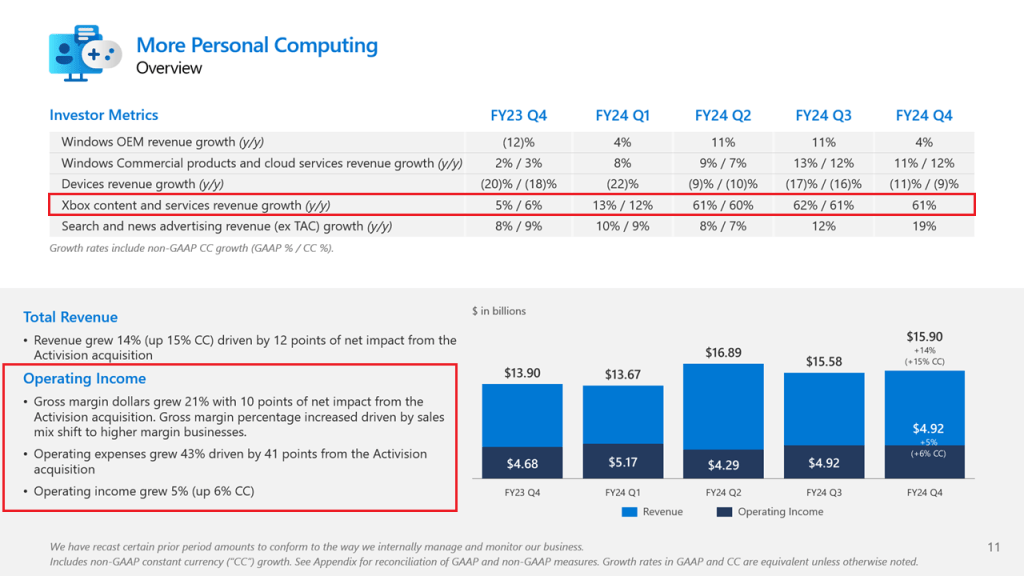
As you’ll see in the gallery above, here’s the scoop on PlayStation’s quarter overall.
- Revenue rose 12% to $5.56B.
- This included $589M of currency impact.
- Operating profit jumped 33% to $419M.
- This included of currency impact.
Excluding currency movement, the top line (revenue) was a slight increase of 1% while the bottom line still generated an impressive 30% gain. Executives did call out first party software sales as one of the contributors, alongside impressive growth for services and add-ons.
The firm also mentioned peripherals. I’d guess partially the DualSense Edge controller and mostly the PlayStation Portal. I’d love if Sony shared more about how the cloud-based streaming handheld is faring. Indicators point to a good amount of demand, I’m just unsure about how many were actually produced for market. I also don’t think the gains were from PlayStation VR2.
There’s also the unfortunate impact of layoffs that are meant to reduce costs, which is one reason G&NS profit metrics are up. It happened after the quarter end, yet something like Bungie is an example that any subsidiary can be hit by layoffs or restructurings in the hopes that these numbers will look better for investors.
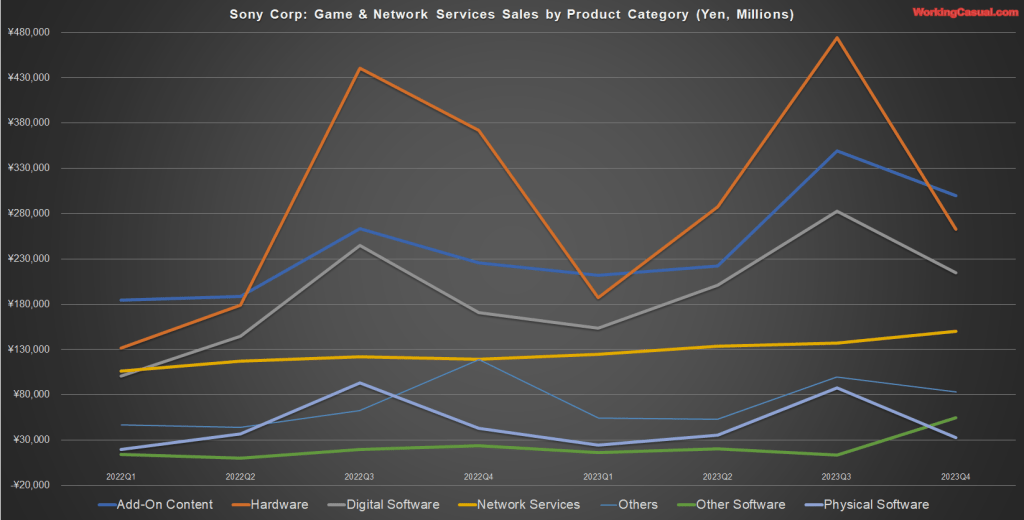
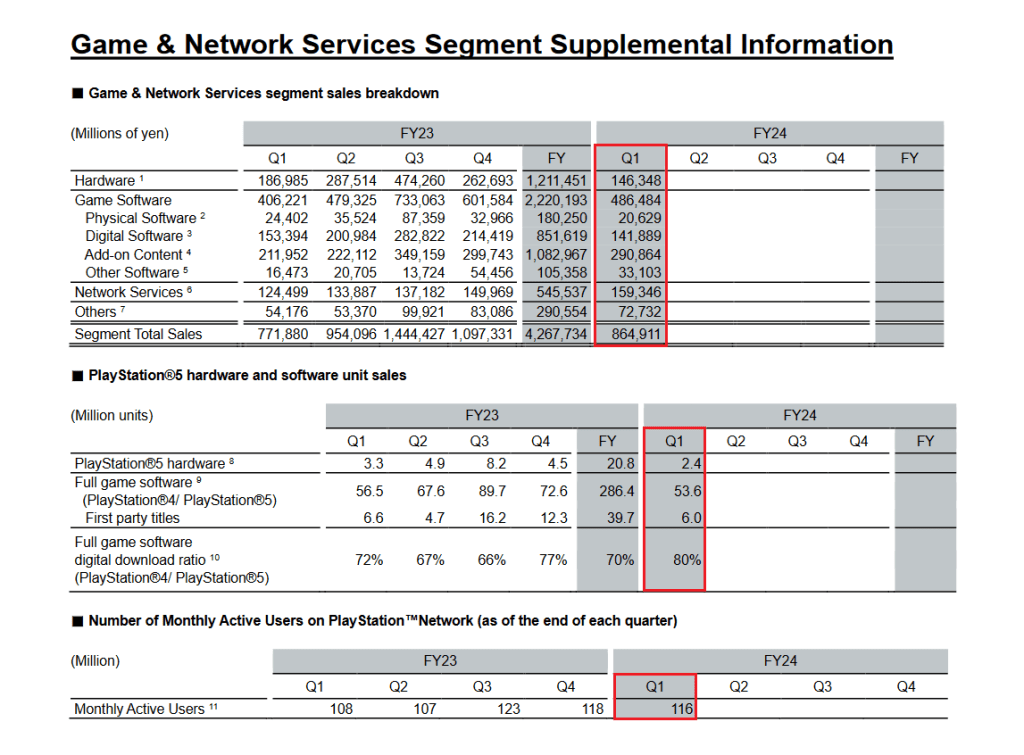
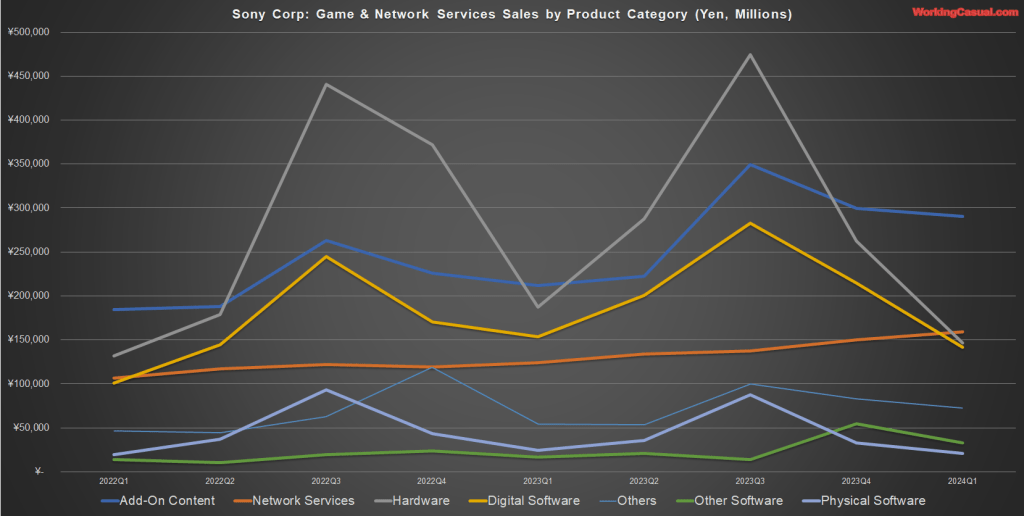
Underlying the sales movement were the following categories by dollar sales:
- Add-On Content rose 37% to $1.87B.
- Network Services increased 28% to $1B.
- Hardware dipped 22% to $941M
- Digital Software lowered 8% to $912M.
The G&NS segment is effectively being carried by its services and downloadable content slices, the knock-on from something like Helldivers 2 or MLB The Show 2024, those PS Plus price increases and the likes of June’s Elden Ring: Shadow of the Erdtree and, albeit to a lesser degree, Destiny 2: The Final Shape expansions.
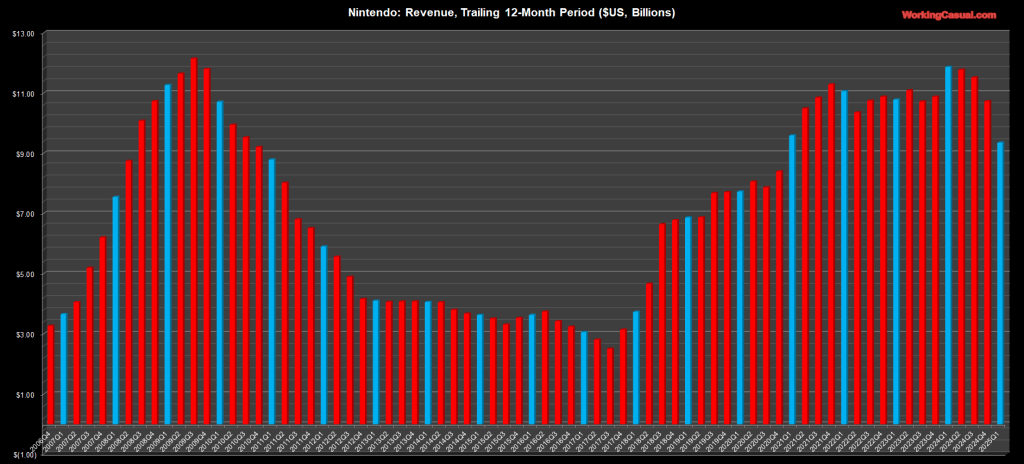
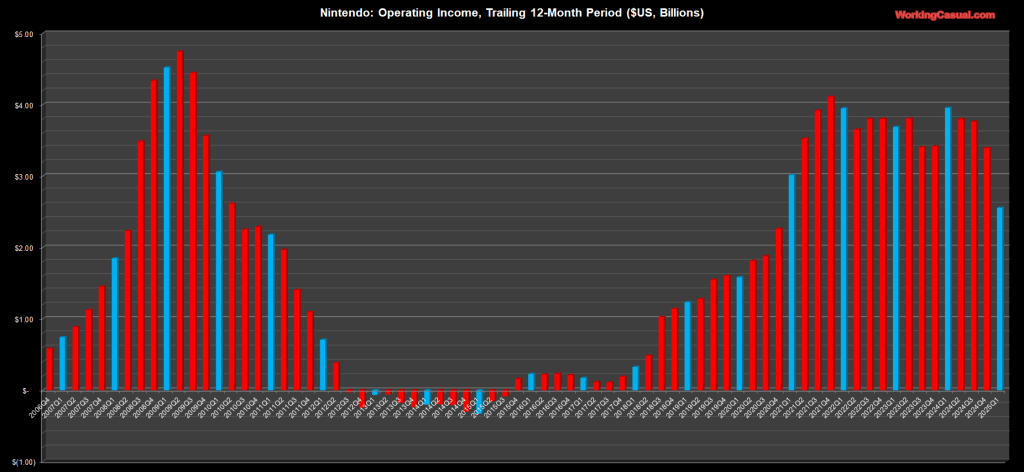
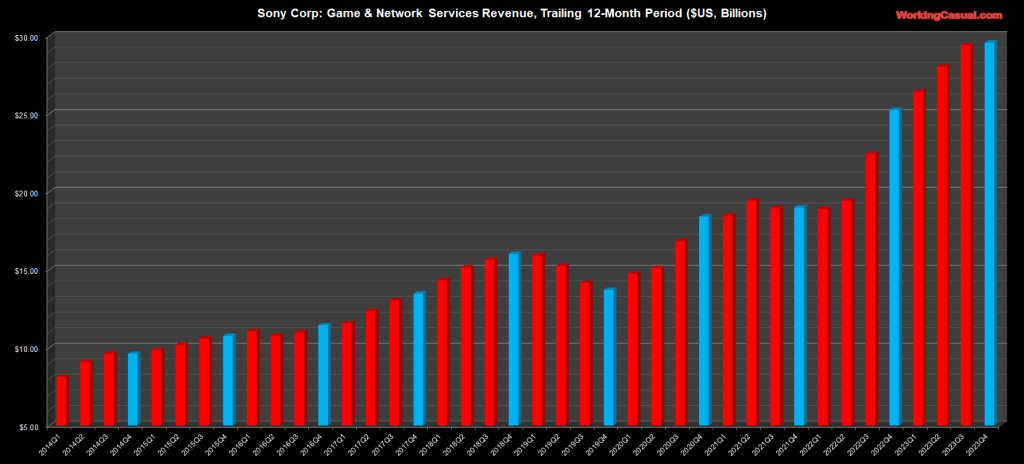
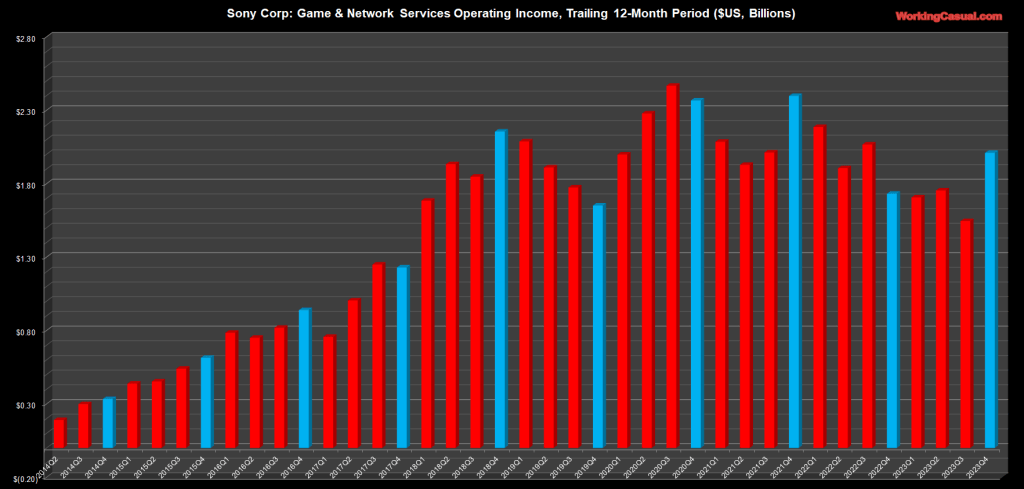
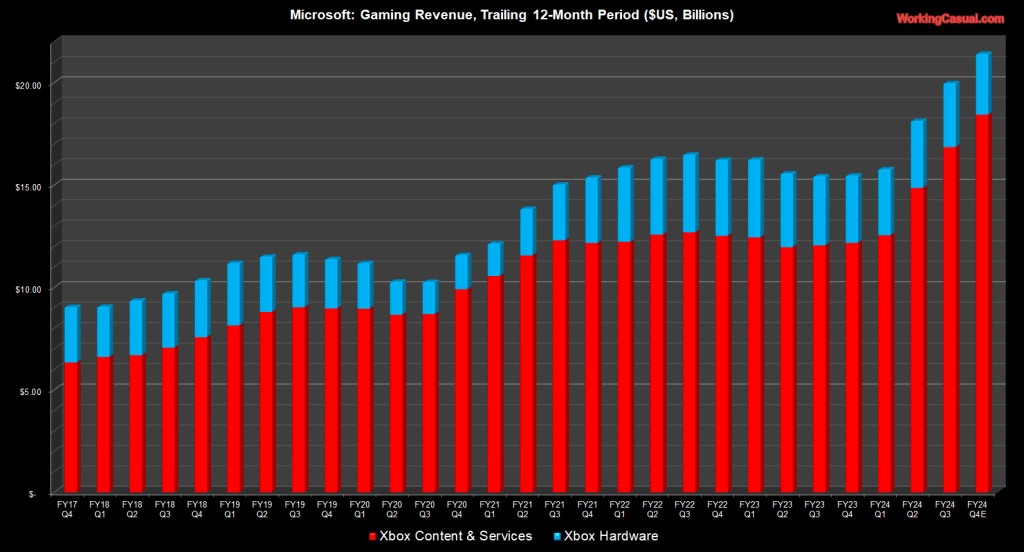
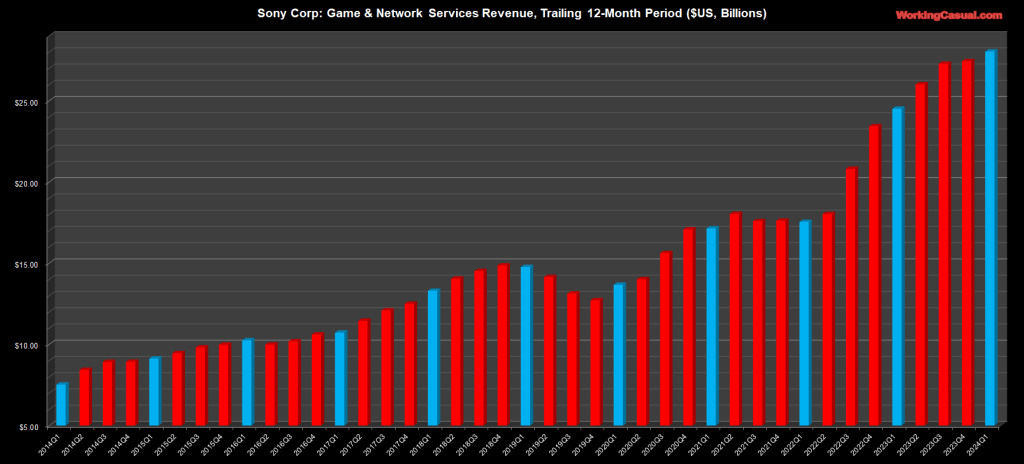
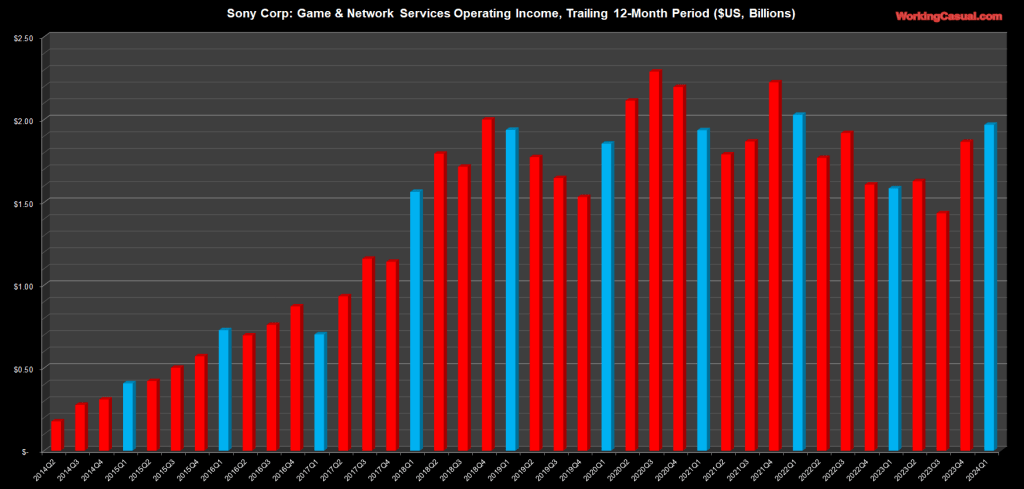
Taking into account this latest quarter, I’ll now tally the trailing 12-month figures.
- All-time high annualized revenue of $28B, up 14%
- Operating profit 24% higher to $1.97B.
In both cases, the annual trend-line is quite positive due to some of the same aforementioned reasons as the quarter, while acknowledging sales are highly susceptible to currency fluctuations.
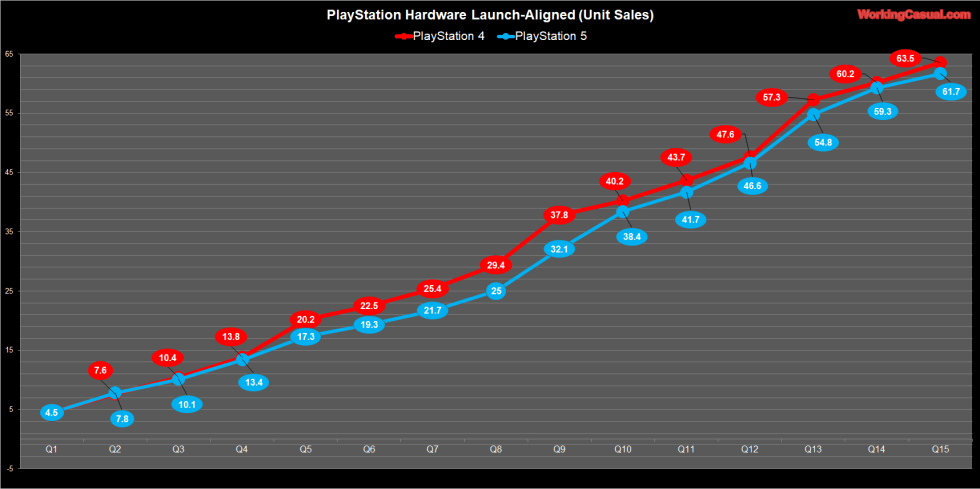
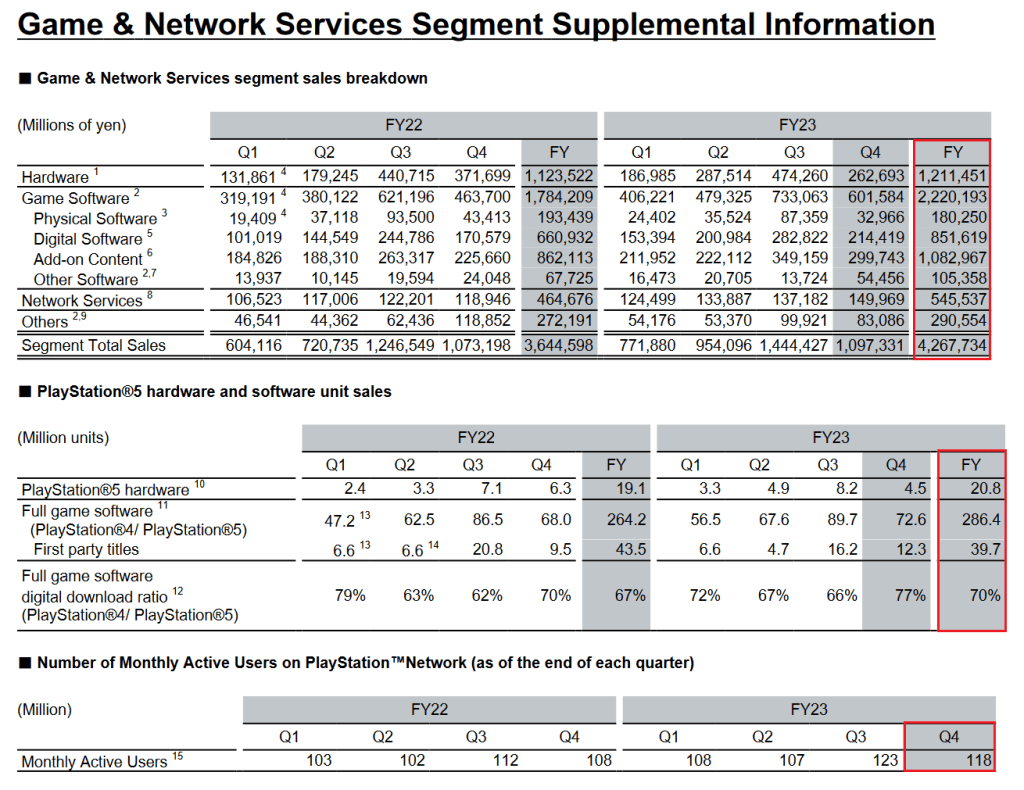
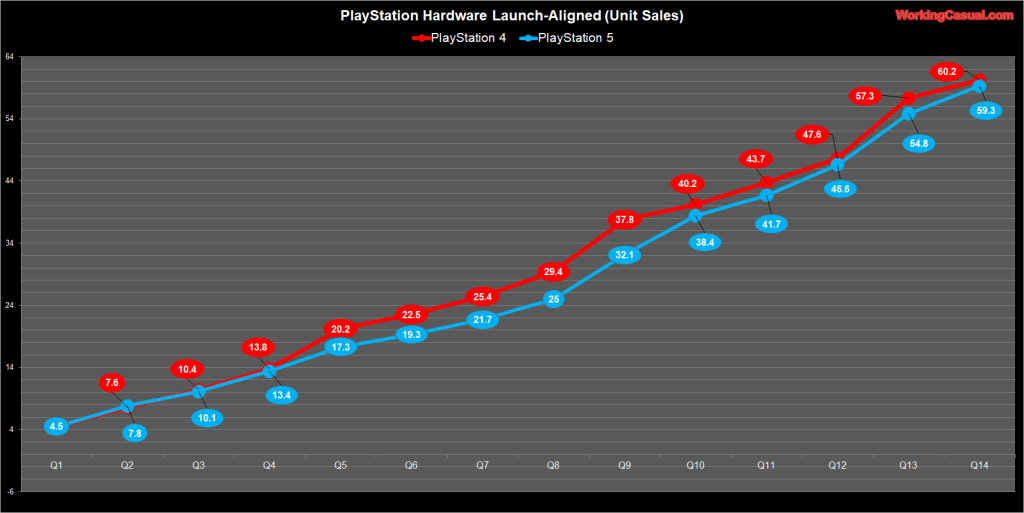
I’ll now expand on the hardware side, namely around units shipped to retail.
- PlayStation 5 shipped 2.4M between April and June.
- During Q1 last year, the console moved 3.3.
- PlayStation 4 also had 3.3M in the same quarter.
- PlayStation 5 lifetime sales are now 61.7M, behind PlayStation 4’s 63.5M.
While these numbers seem gloomy, I wouldn’t yet overreact on this console generation. (Not until next year’s Grand Theft Auto VI, at least.) PlayStation 5 is keeping up with or exceeding the sales speed of consoles historically. It’s trending 7% above PlayStation 4 in the United States, according to Circana, and will be the top seller in most key markets this year.
It’s no secret PlayStation 5 adoption is slower than the previous cycle. Sony also didn’t provide an update on sell-thru to consumers, which was at 50M back in December 2023. Based on this, I assume it hasn’t crossed the 60M milestone despite shipping nearly 62M to date.
Now, switching over to software unit sales stats from this latest announcement.
- Game sales across PlayStation were 53.6M, down from 56.5M.
- First party titles totaled 6M, compared to 6.6M.
- Digital downloads contributed 80%. (Pretty sure an all-time high.)
Management attributed growth from software to first party sales, which I assume counts Koei Tecmo’s Rise of the Ronin and Shift Up’s Stellar Blade, both of which were published by Sony Interactive Entertainment. There was also May’s PC launch of Ghost of Tsushima, fitting with the firm’s strategy of diversifying beyond consoles.
Signs point to lower output on the third party side for Final Fantasy 7 Rebirth, compared to last year’s Final Fantasy XVI. These exist under a console exclusive relationship that will probably go away soon based on Square Enix’s decision to shift towards multiple platforms.
In terms of general engagement, which is often driven by evergreen games like Minecraft, Fortnite and Roblox in combination with newer experiences, Monthly Active Users (MAUs) across PSN jumped from 108M to 116M. It was down sequentially since the March quarter’s 118M.
It was a decent start to PlayStation’s 2024 fiscal year, featuring slight revenue growth excluding currency impact, a nice boost to operating profit and a great supplement from PSN alongside its subscription business. Publishing partnerships with Asian developers like Team Ninja and Shift Up appear to have appeal within Sony’s global user base, even if not directly driving console sales.
PlayStation 5 may have very well peaked, indicated by a couple quarter’s worth of lower unit sales, though we’ll know for sure if that’s the case within the next year or so between the potential for an upgraded model plus a massive Rockstar Games title that may well lead to widespread upgrades.
Progressing into the fiscal year, it’s time to review Sony’s increased annual outlook for PlayStation.
- Now expects full year revenue up 1% to $27.8B.
- It would be a new local currency record.
- Operating profit guidance is now $2.1B, which would be up 10%.
- PlayStation 5 shipment forecast remained at 19M, unless I hear otherwise.
I’d see this sort of slight upward revision in guidance as reassuring, especially since it happened in a first quarter, when companies are often unsure about moving around their expectations.
Especially with the yen’s continued weakness, the revenue number should be achieved. That level of profit is also reasonable, even if I see downside depending on how PlayStation navigates costs, for example if a new PlayStation 5 is in development and production.
It’s that hardware portion where I’m more cautious than management. I initially thought Sony might increase the forecast over the fiscal year. I’m now betting it remains flat into next quarter. Personally, I have PlayStation 5 units at 19M to 19.5M in fiscal 2024.
Sony needs a spark, and it doesn’t have much on the exclusive side as the commercial season ramps up. There’s live service shooter Concord, which has been praised during its testing phase though there’s questions around its broad interest. AstroBot is a near full-priced platformer, the closest thing to the brand’s true mascot. I’m not sure it’s blockbuster or system-seller material.
I see more impact from external titles, for instance Ubisoft’s double feature of Star Wars Outlaws and Assassin’s Creed Shadows. Electronic Arts has its sports franchises, including the likes of July’s EA Sports College Football 25 at 5 million players strong. Then there’s Call of Duty: Black Ops 6 from Activision Blizzard which might be hampered in this context by its inclusion on Game Pass.
The elephant in the room is how about that long-rumored PlayStation 5 Pro? The closer we get to the holidays, the more dubious I become it will both hit market in 2024 and have a notable impact outside of “enthusiast upgraders.” If a fancy model is going to be out by October or November, Sony’s running out of time to start up a big marketing push.
Thanks again to everyone who stopped by for my latest recap of a major player in the games industry. Be safe and take care, all!
Note: Comparisons are year-over-year unless otherwise noted.
Exchange rate is based on reported average conversion: US $1 to ¥155.6.
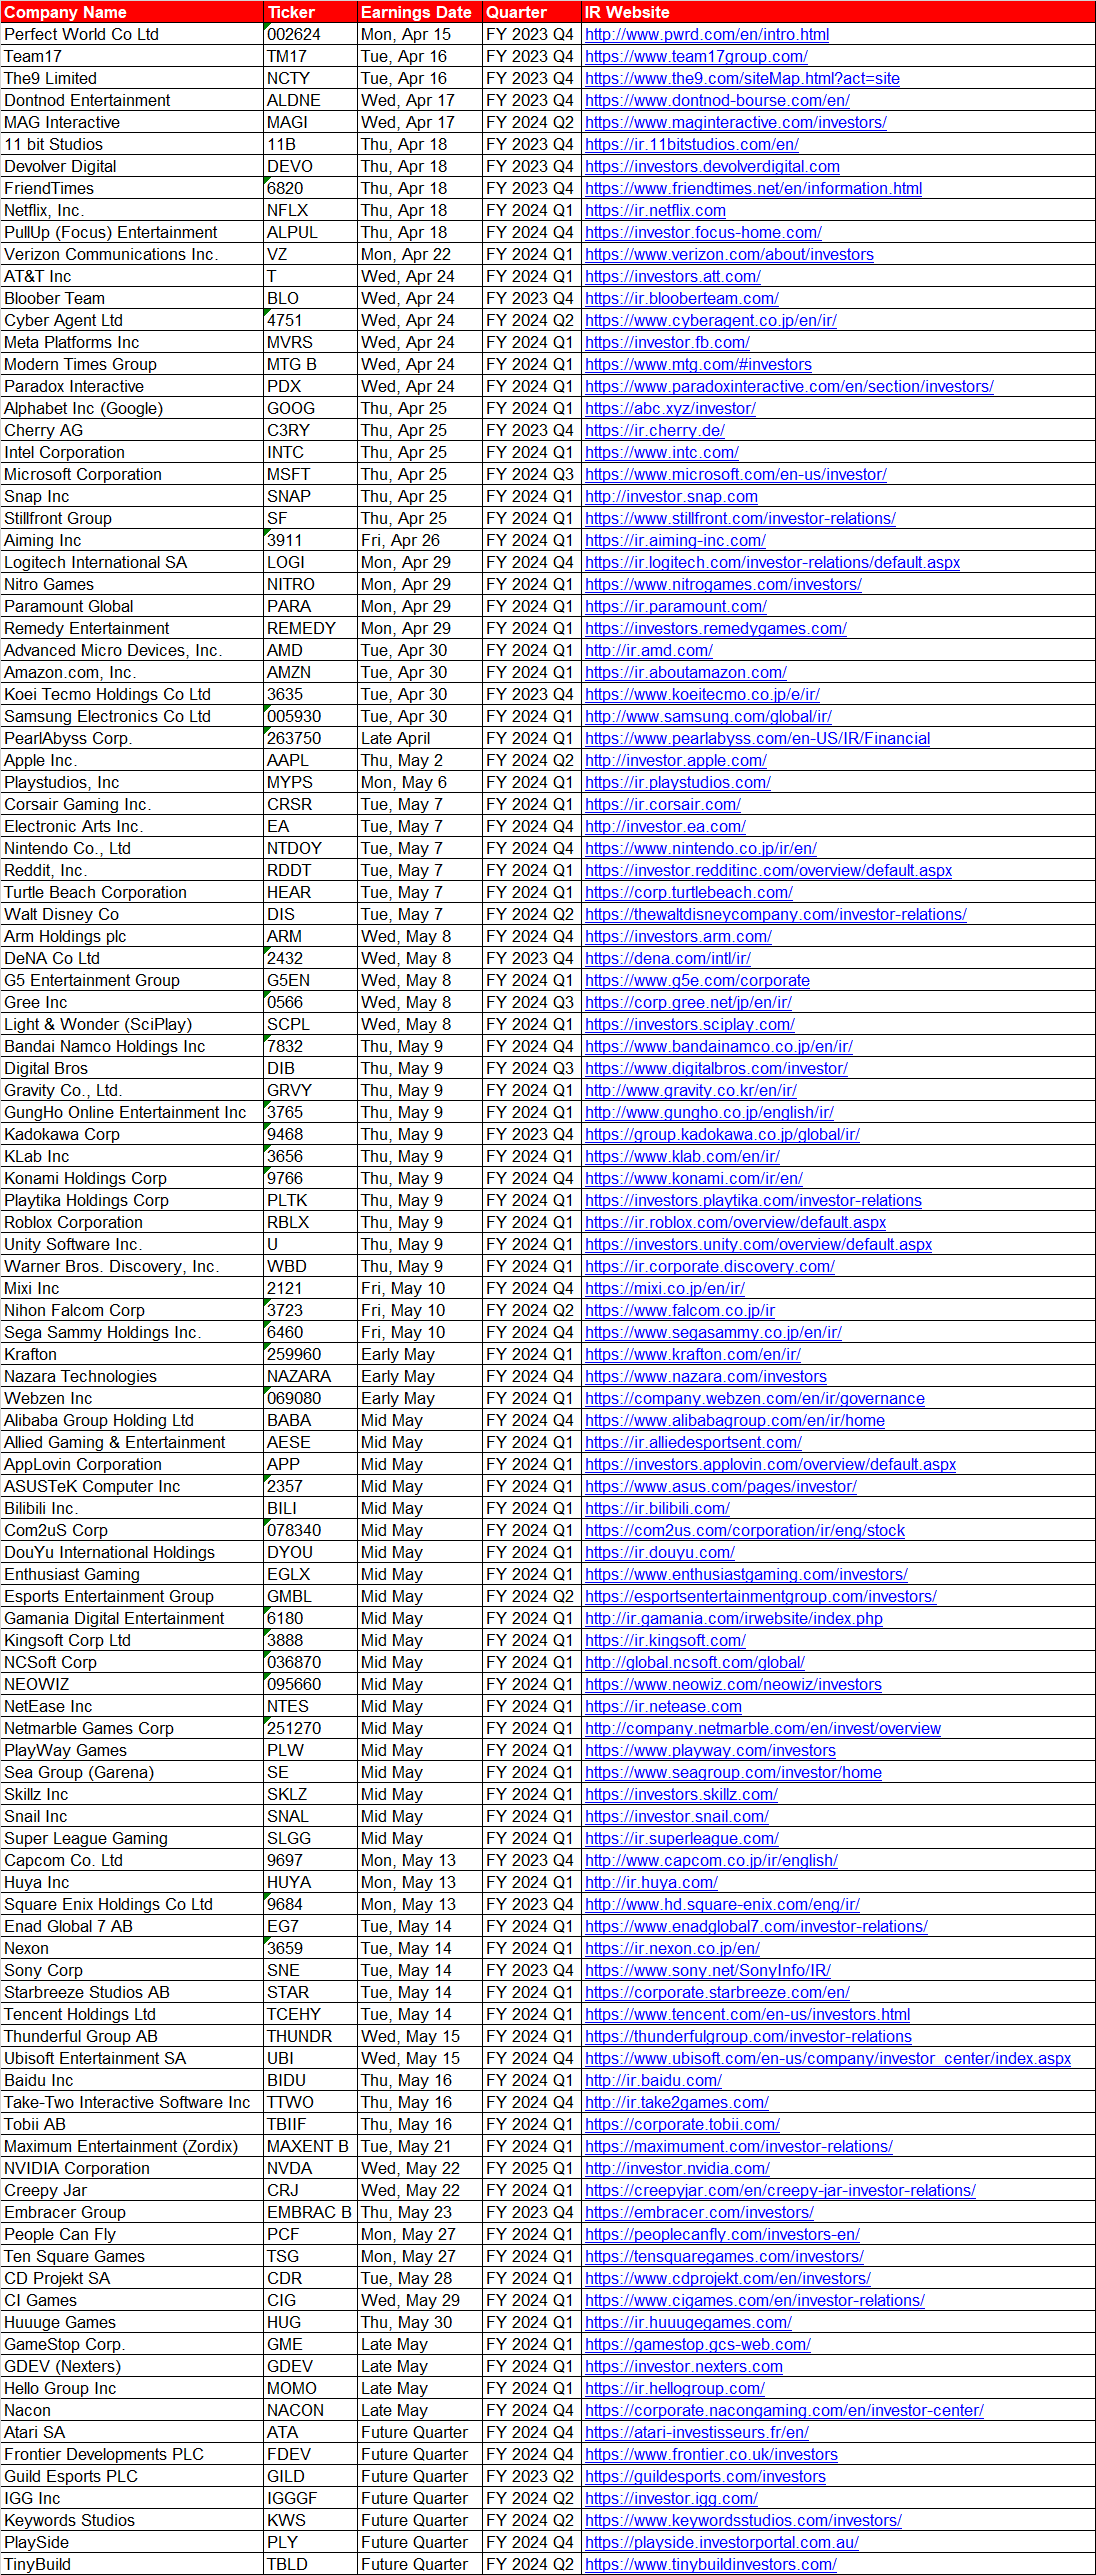
Sources: Circana, Company Investor Relations Websites.
-Dom